BTC/USDT – Updated Analysis (Daily Chart)
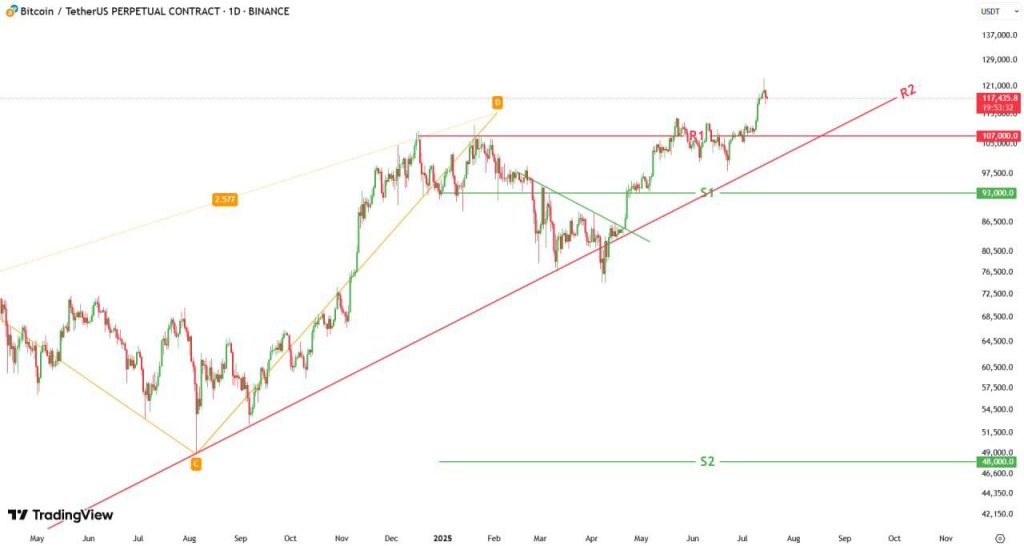
Price successfully broke above the key R1 resistance (~107,000 USDT), confirming strong bullish momentum. It’s now trading around 117,400 USDT, testing the extended trendline labeled R2, which is acting as dynamic resistance.
Pattern ABCD: Still visible with point D having completed earlier. This implies that price could be in a wave extension or consolidation phase.
BTC is now testing upper resistance (R2), making this a potential pause or breakout zone. Keep eyes on R2 reaction — breakout = continuation, rejection = possible retest of 107K.